


Introduction
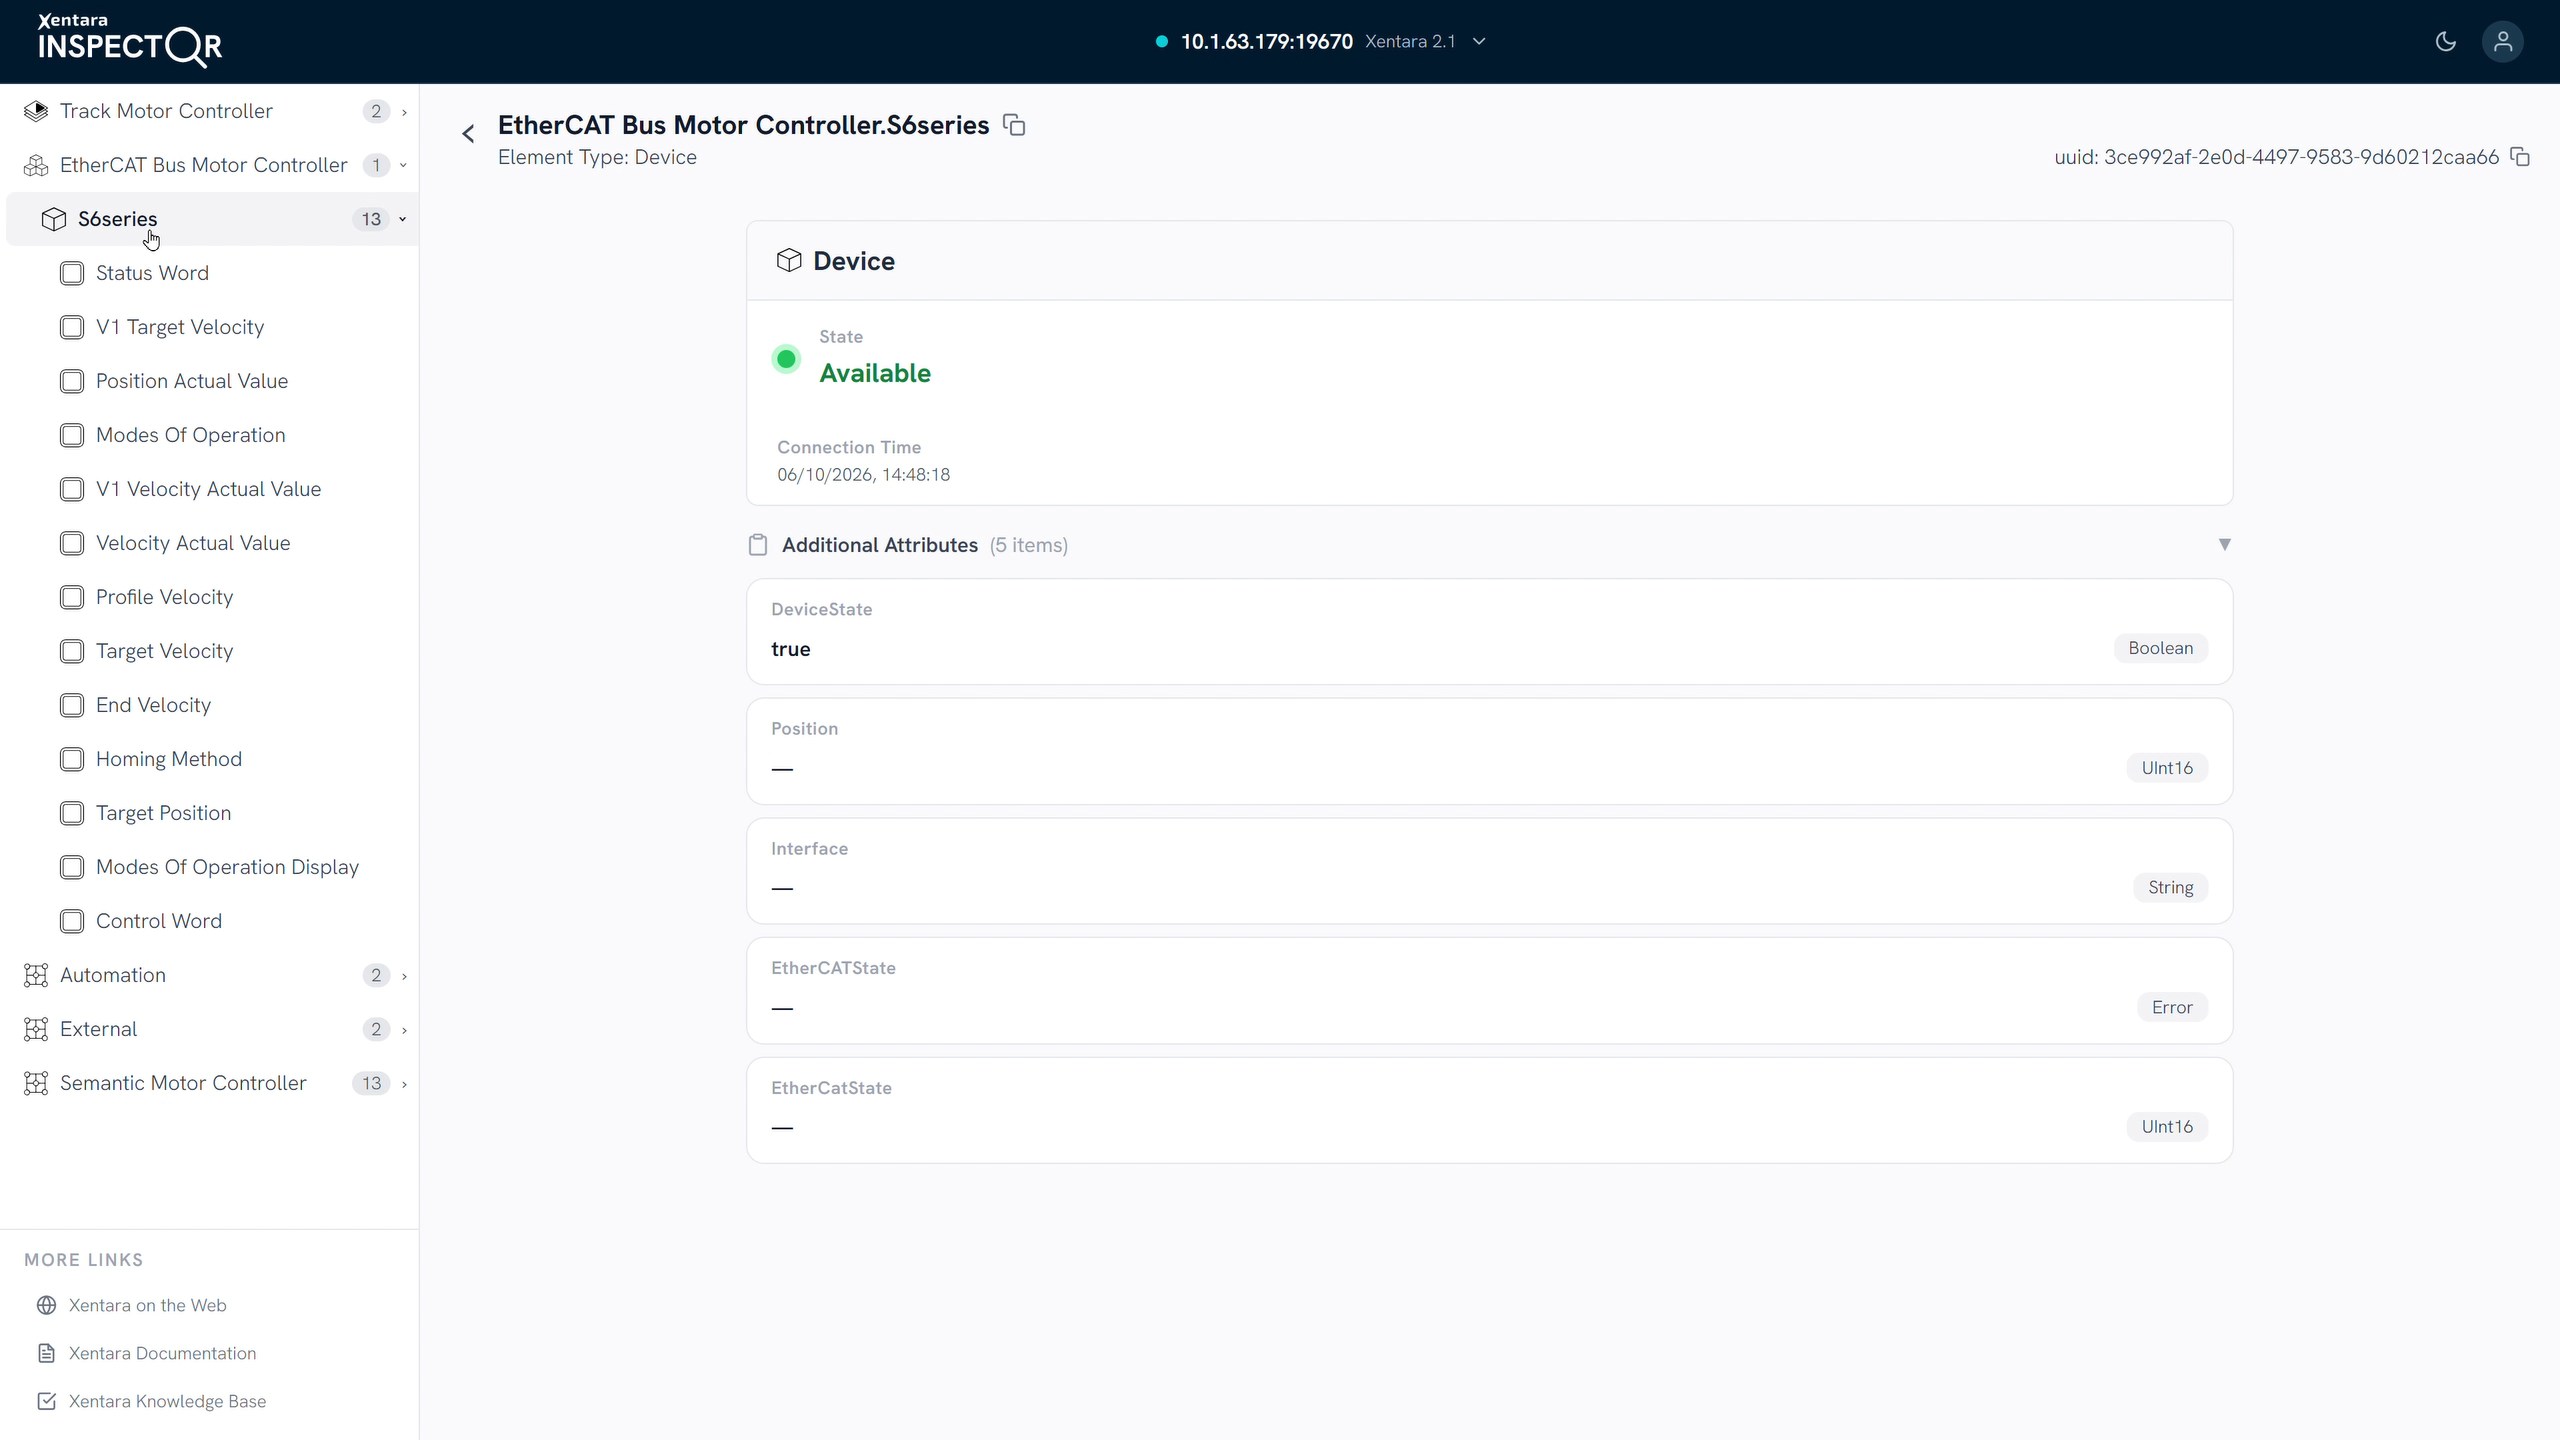
The Xentara Inspector (V1.0) is a web app for accessing the live data model of a running Xentara instance from your browser. It shows the element tree of your model, the live value and quality of every data point, and when each value was last updated and changed. Writable data points can be changed directly from the browser.
The Inspector is delivered as a Docker image with its own web server. You don't have to install it on your system; just start the container, connect through your browser and log in with a valid set of user credentials. You don't have to change anything in your Xentara model.
Prerequisites
To wortk with the Xentara Inspector, you will need the following:
- Xentara 2.1: Earlier releases (2.0 and below) do not support the Inspector. The WebSocket interface has to be enabled.
- A valid username and password for access to your Xentara project.
- Docker: You need to install the Docker Engine with the Compose plugin on Linux, or Docker Desktop on Windows.
- Browser: We recommend using Chrome, Edge or Firefox. The browser should be a current version.
NB: Run the Inspector on the same machine as Xentara. The Inspector looks for an active Xentara service on the machine it was loaded from, on port 19670.
If Xentara runs on a Linux machine, you can install the Inspector there and use the browser on your Windows PC to access the system.
What is in the image
- The ready-built Xentara Inspector web app.
- An nginx web server that only serves the web app. Live data goes directly from the browser to Xentara, not through the container.
- Builds for linux/amd64 and linux/arm64. Docker picks the right one automatically.
Part A - Install on Linux
Step 1 - Start Xentara
Xentara must be running before you start or open the Inspector. If it is not, the login fails with Could not connect to Xentara. Check that Xentara is listening:
sudo ss -ltnp | grep :19670You should see a line similar to this:
LISTEN 0 512 *:19670 *:* users:(("xentara",pid=609597,fd=15))No output means Xentara is not running. Start it, then check again. The port is set in under ~/.config/xentara/config.json under httpServer.port; if there is no entry in the config file, Xentara uses 19670 by default.
Step 2 - Create the compose file
Create a folder for the Inspector and switch into it. All later commands are run from this folder:
mkdir -p ~/xentara-inspector && cd ~/xentara-inspectorCreate the file docker-compose.yml. It tells Docker which image to run (xentara/xentara-inspector:1.0), what to name the container, to restart it automatically after a reboot, and to make the Inspector available on port 8090:
cat > docker-compose.yml <<'EOF'
services:
  inspector:
    image: xentara/xentara-inspector:1.0
    container_name: xentara-inspector
    restart: unless-stopped
    ports:
      - "8090:8080"
EOF
Step 3 - Download and start the Inspector
Download the Inspector image from Docker Hub. Docker picks the right version for your CPU automatically:
sudo docker compose pullStart the Inspector in the background. The "-d" parameter returns you to the prompt while the container keeps running:
sudo docker compose up -dAfter about 30 seconds, check that the container is running.:
sudo docker psThe xentara-inspector row should show "Up (healthy)" and "0.0.0.0:8090->8080/tcp".
Next check whether the Inspector website answers.:
curl -I http://localhost:8090The first line of the response should be "HTTP/1.1 200 OK".
Note: Run all docker compose commands inside ~/xentara-inspector, otherwise Docker reports no configuration file provided.
The Inspector restarts automatically after a system reboot.
Step 4 - Allow remote access (only if you use a firewall)
Other computers must reach both ports: 8090 for the website and 19670 for live data. For example, with ufw use the following commands:
sudo ufw allow 8090
sudo ufw allow 19670
Part B - Install on Windows
Step 1 - Start Xentara
Xentara must be running on the Windows machine before you start or open the Inspector, otherwise the login fails with Could not connect to Xentara. Check in PowerShell:
Get-NetTCPConnection -LocalPort 19670 -State ListenA result line means Xentara is listening. An error or empty output means it is not running.
Step 2 - Install and start Docker Desktop
Install Docker Desktop from docker.com and start it. Wait until it shows Engine running. In Settings → General, turn on Start Docker Desktop when you sign in, so the Inspector also starts after a reboot.
Step 3 - Create the Compose File
Open PowerShell (Start menu → type "PowerShell"). Create a folder for the Inspector in your user folder and switch into it. All later commands are run from this folder:
mkdir $HOME\xentara-inspector
cd $HOME\xentara-inspector
Create the file docker-compose.yml. It tells Docker which image to run (xentara/xentara-inspector:1.0), what to name the container, to restart it automatically when Docker Desktop starts, and to make the Inspector available on port 8090. Copy the whole block, from @' to docker-compose.yml, and paste it in one go:
@'
services:
  inspector:
    image: xentara/xentara-inspector:1.0
    container_name: xentara-inspector
    restart: unless-stopped
    ports:
      - "8090:8080"
'@ | Set-Content -Encoding utf8 docker-compose.yml
To check that the file was created:
Get-Content docker-compose.ymlStep 4 - Download and start the Inspector
Make sure Docker Desktop is running ("Engine running").
Download the Inspector image from Docker Hub. Docker picks the right version for your CPU automatically:
docker compose pullStart the Inspector in the background. The "-d" parameter returns you to the prompt while the container keeps running:
docker compose up -dAfter about 30 seconds, check that the container is running:
docker psThe xentara-inspector row should show "Up (healthy)" and "0.0.0.0:8090->8080/tcp." You can also see it under "Containers" in Docker Desktop.
Check whether the Inspector website answers:
curl.exe -I http://localhost:8090The first line of the response should be "HTTP/1.1 200 OK". In PowerShell, make sure to type curl.exe; plain curl is a different PowerShell command and gives a confusing error.
Step 5 - Allow network access
If Windows Firewall asks, allow access so other PCs can reach ports 8090 and 19670.
Part C - First Login (Linux and Windows)
Step 1 - Open the Inspector
Open a web browser of your choice and anter the address "http://<MACHINE-IP>:8090", where <MACHINE-IP> is the IP address of the system Xentara is running on. If you do not know the IP of your target system, you can find it with the commands "hostname -I" on Linux or "ipconfig" on Windows.
If Xentara is running on the machine you are using, simply use "http://localhost:8090".
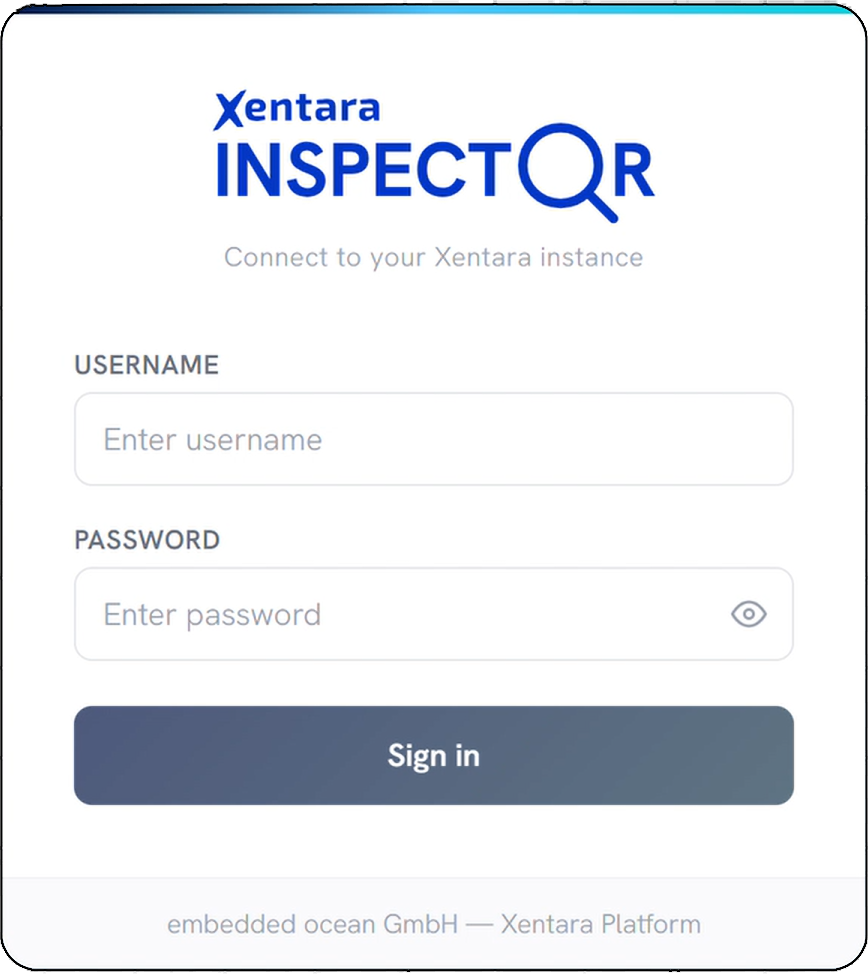
You should now see the Inspector login screen.
Step 2 - Trust the Xentara certificate (once per browser)
Xentara uses a self-signed certificate to ensure your connection is safe and encrypted. That means your browser has to accept and install the certificate before you can access the Inspector. It's a simple process; just follow this checklist.
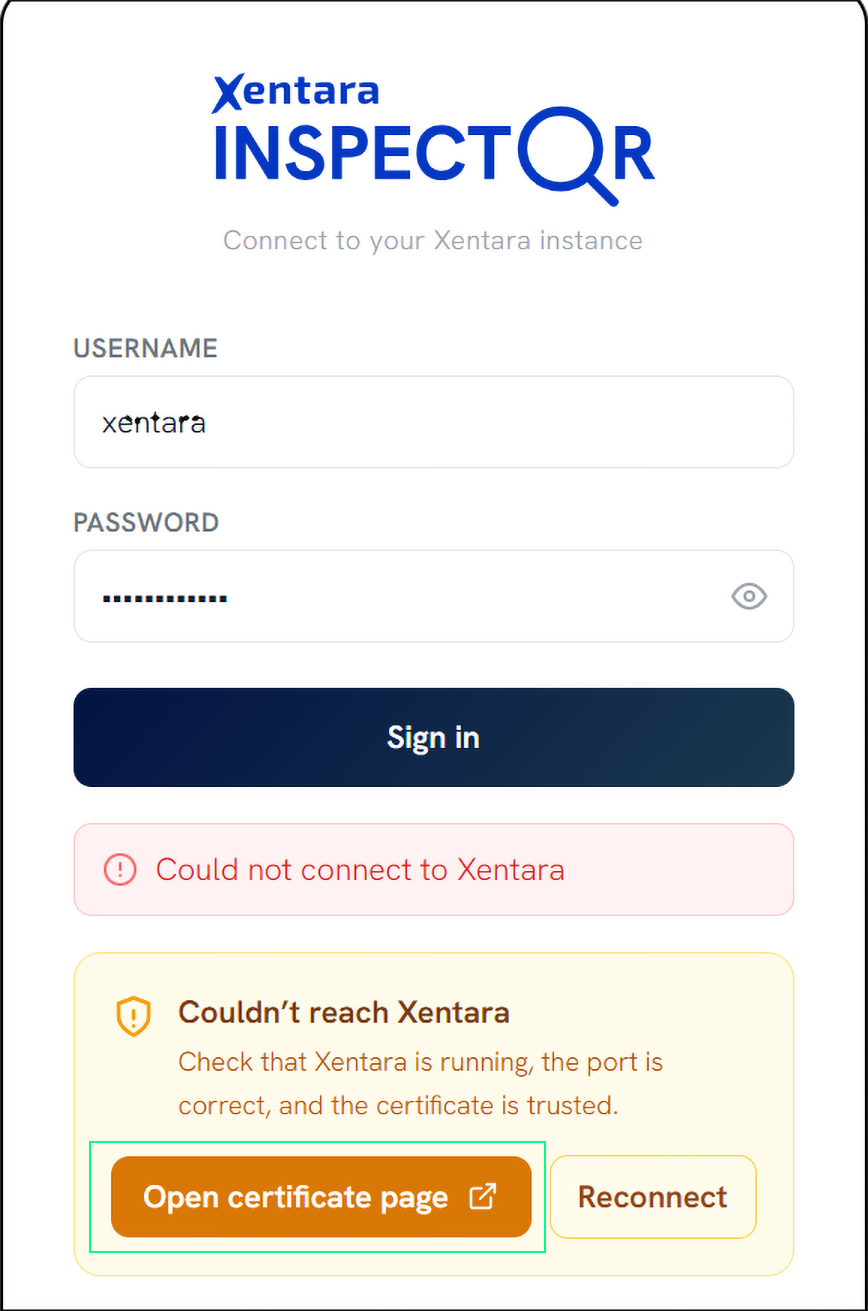
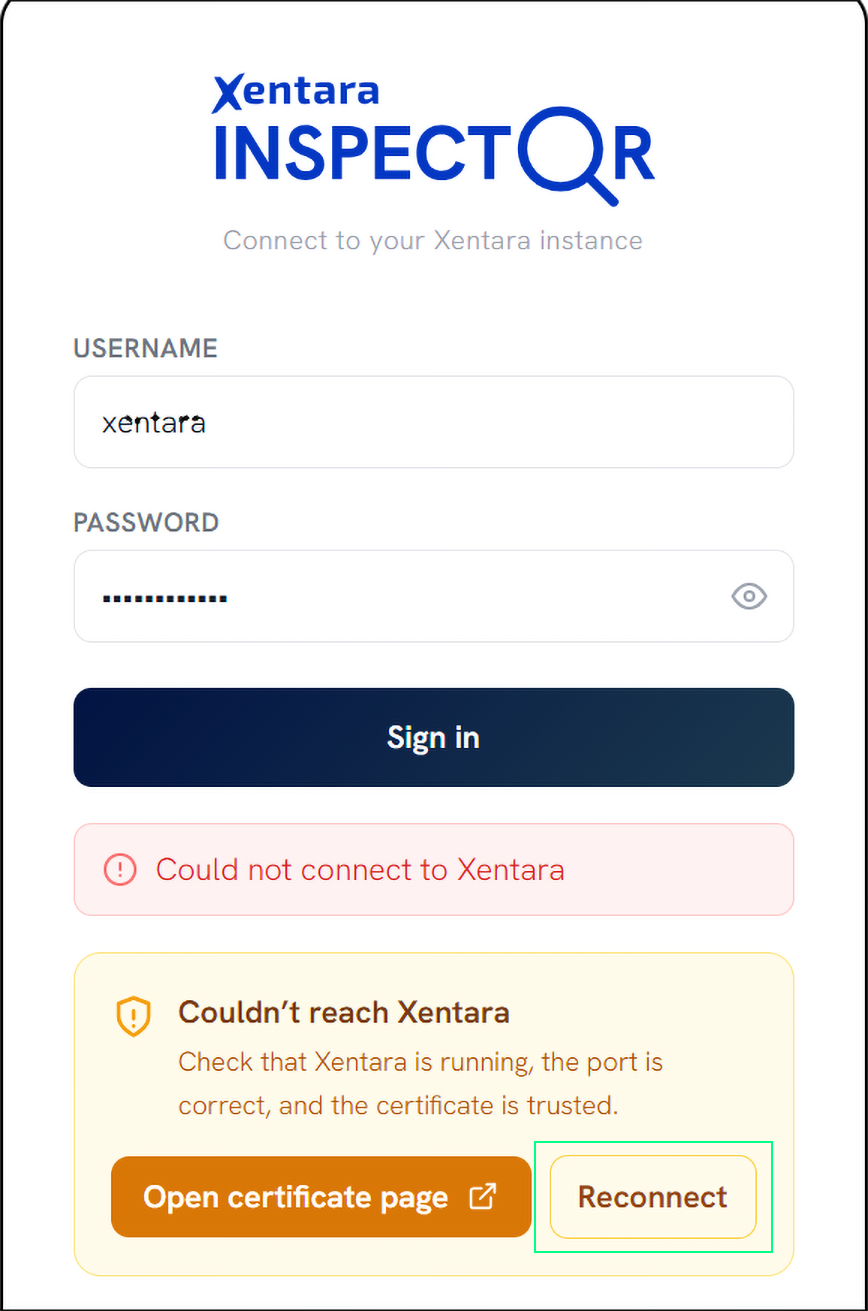
- On your first login attempt, you will see a warning message that says "Could not connect to Xentara".
- Click Open certificate page. A new browser tab opens.
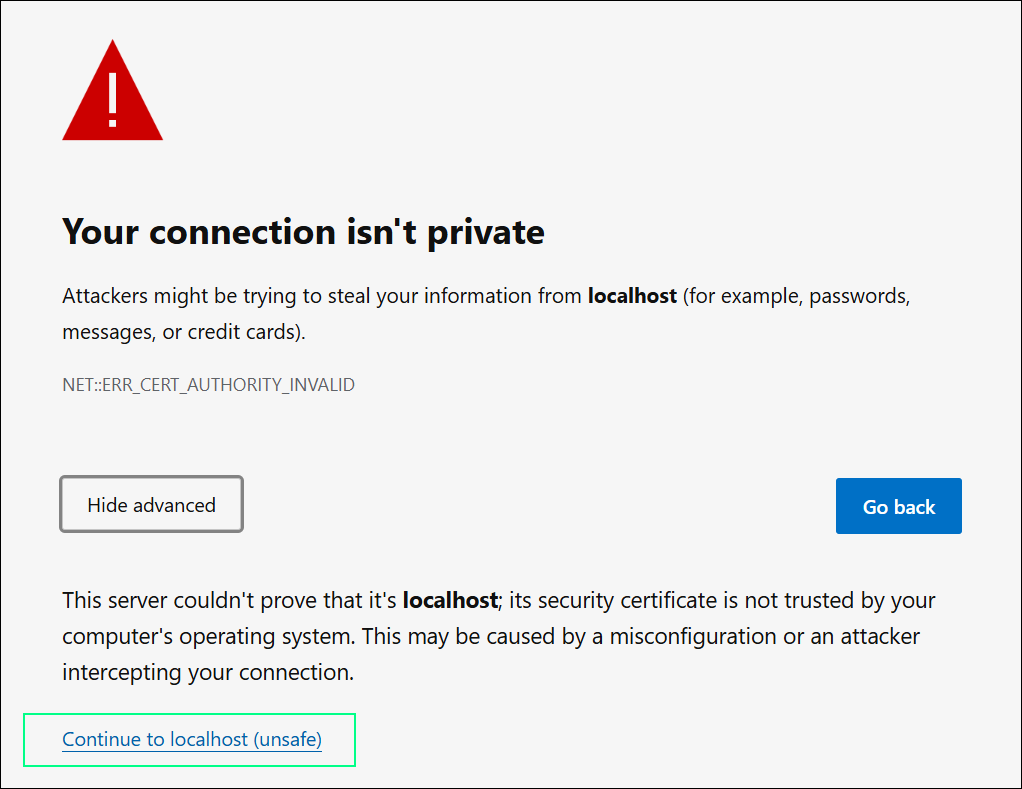
- In the new tab, the browser will show a warning page saying "Your connection is not private." Don't worry, this just happens because we can only provide a safe connection after accepting the certificate. Click Advanced, then click on the new option that says "Continue to [either "localhost" or your target machines's IP] (unsafe)" (see below).
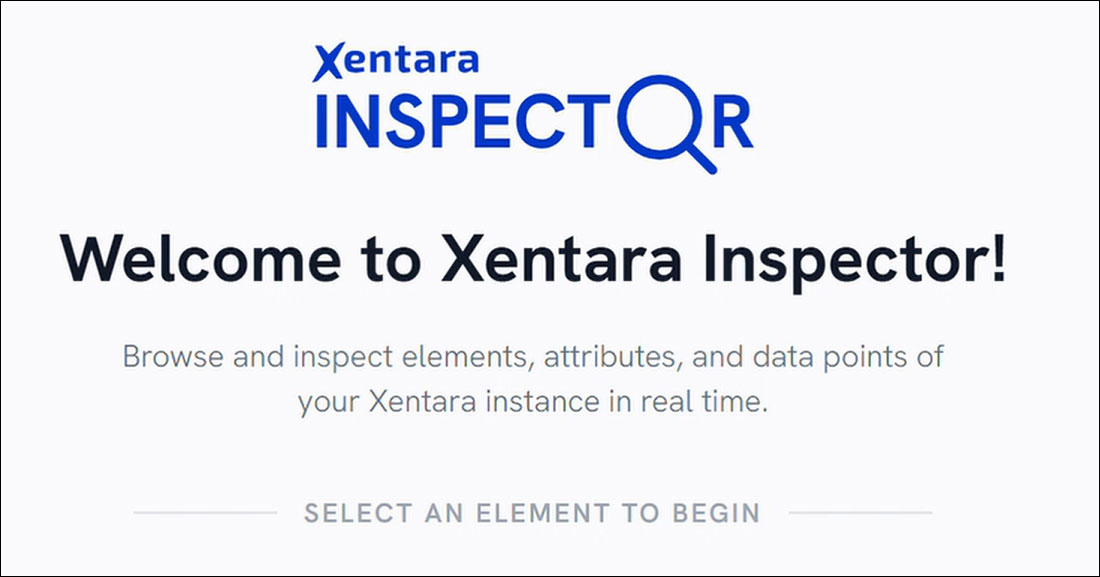
- You will be taken to the Welcome to Xentara page, which also shows the Xentara version running on your system. The certificate is now trusted.
- Close the tab, go back to the Inspector and click Reconnect.
These steps only have to be completed once. If you switch to a different browser, you will have to accept the certificate for that browser again.
Step 3 - Sign in
Enter your Xentara username and password and click Sign in. You will see the Xentara Inspector welcome screen. The bar at the top of the screen also displays the IP of the target system and the version of Xentara running.

You can log out at any time by opening the user menu (icon at the top right of the screen) and clicking "Logout".
Part D - Using the Inspector
Browse the model
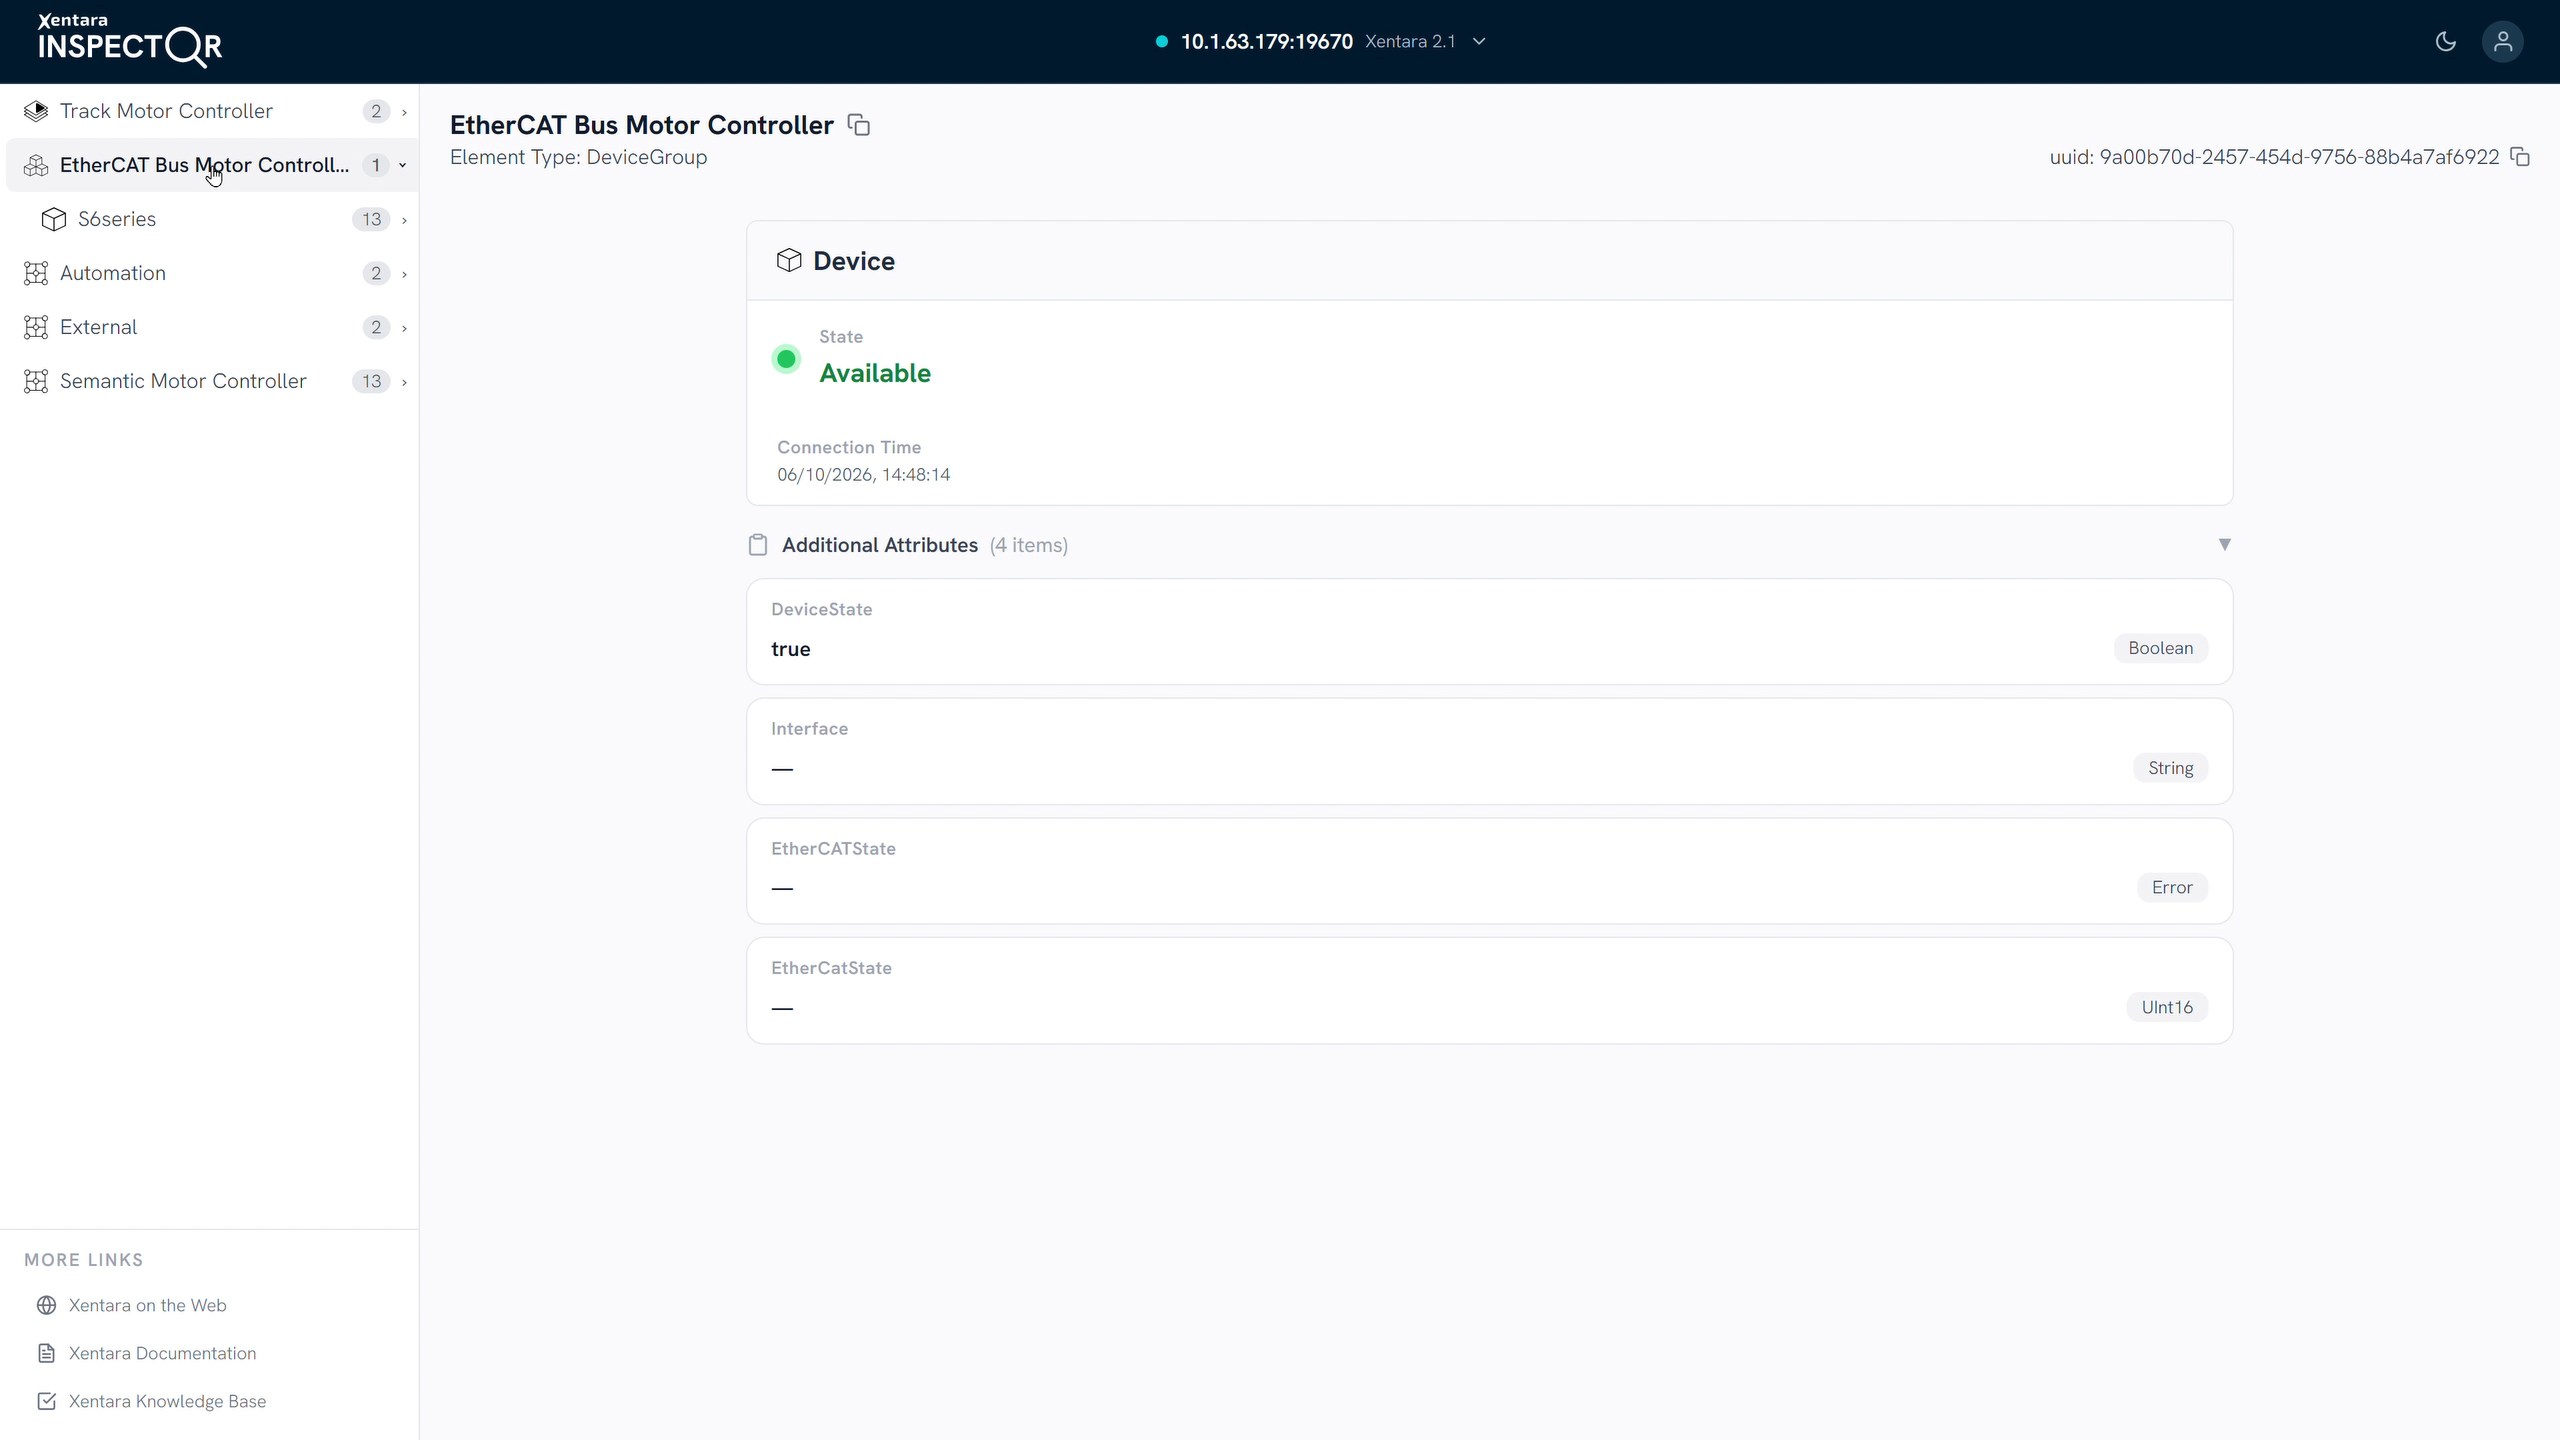
The sidebar on the left shows the elements tree of your model. Click an element to open it, click again to expand its children. The number next to an element is its number of children. The top of each page shows the element’s full name, type and UUID, with copy buttons. Click the connection bar at the top to see the logged-in user and the model file.
Watch Live Values
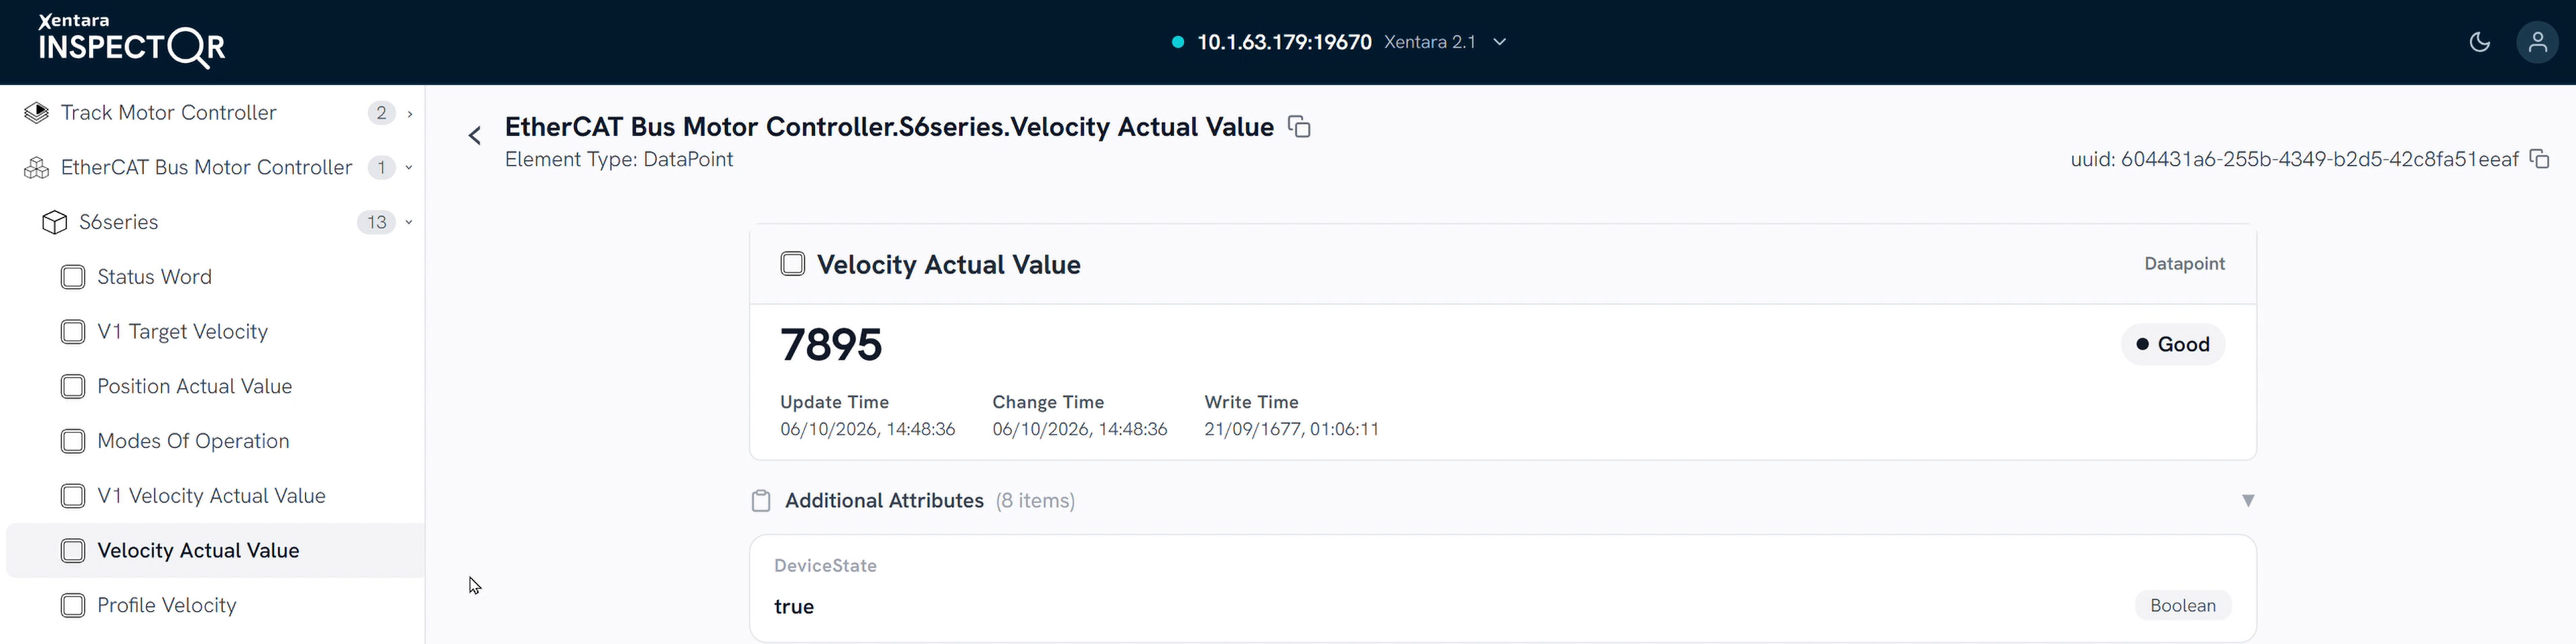
Open a data point. Its card shows:
- Value, updated live while the card is open.
- Quality as a coloured badge: Good, Acceptable, Unreliable or Bad (see here for details on how data quality is determined)
- Update Time and Change Time of the value.
- Additional Attributes further down, with their data types.
Edit a Value
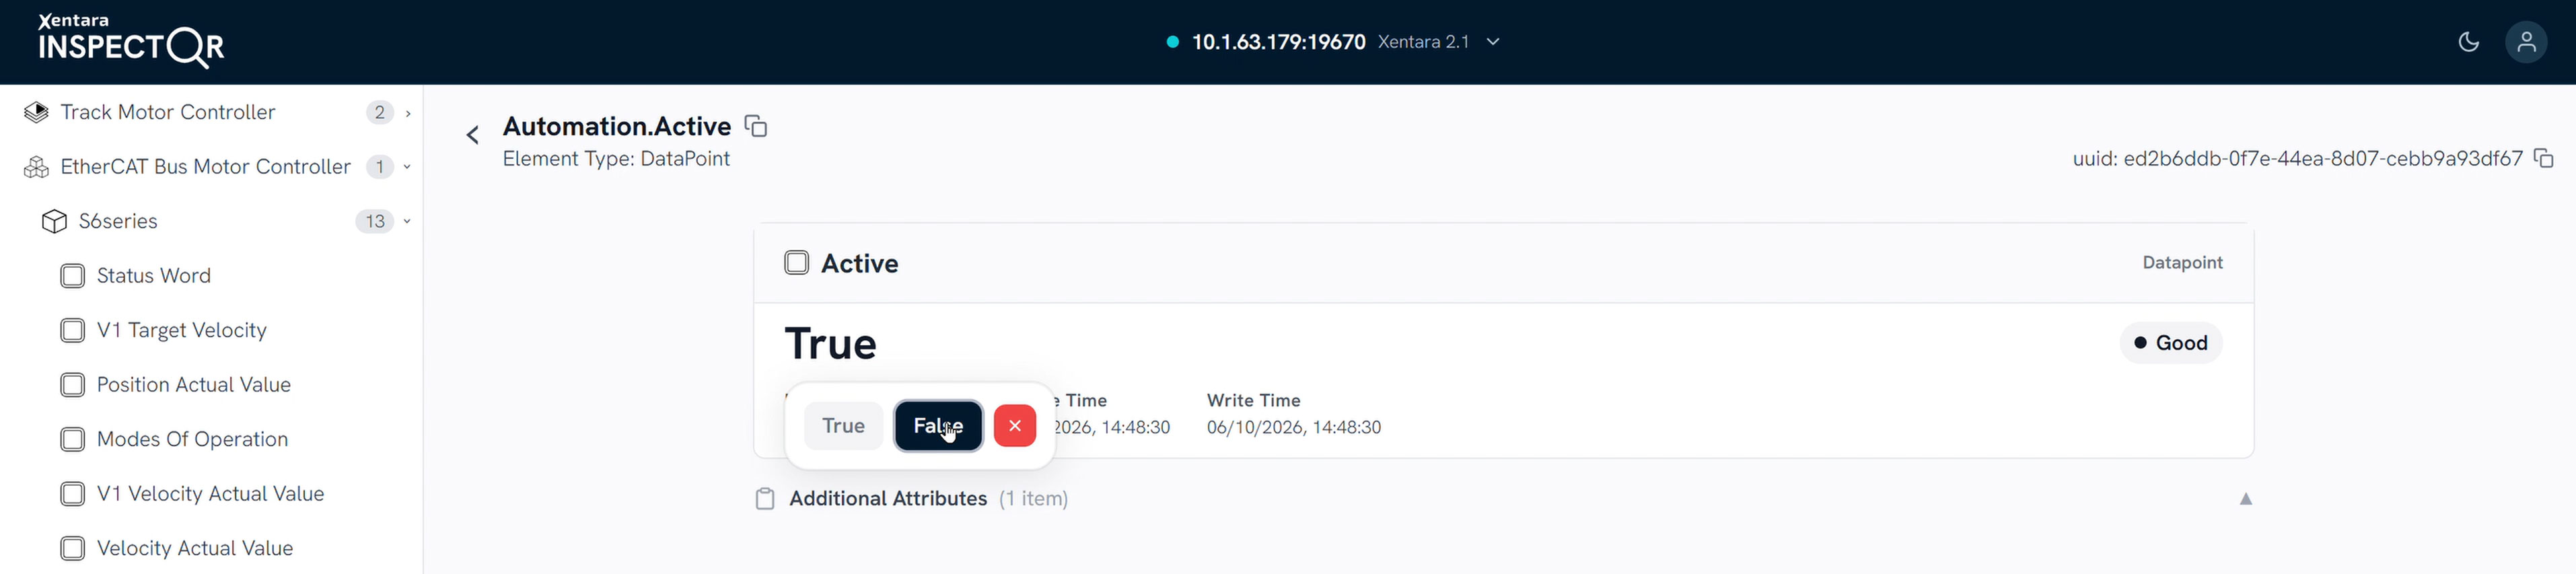
Writable data points show a pen icon next to the value. Click it, type the new value and confirm with the check mark or by pressing the "Enter" key. For true/false values you get two buttons instead. Read-only data points can not be edited and have no pen icon.
Troubleshooting
Start with docker logs xentara-inspector (with sudo on Linux).
Possible issues |
How to fix |
| Error message "Could not connect to Xentara" | Xentara is not running, or the certificate is not trusted. Start Xentara first (Part A/B, Step 1), then do Part C, Step 2. |
| Error message "Wrong username or password" | Xentara was reached but rejected the login. Make sure you typed username and password correctly. Both are case sensitive. If in doubt, check the users configured in Xentara. |
| Inspector works on the machine Xentara runs on, but can not be reached from another PC | A firewall blocks Port 8090, 19670, or both. Open both ports for remote access (Part A Step 4 / Part B Step 5). |
| Login fails, browser console shows a CORS error | Xentara restricts which addresses may connect. Add the Inspector address, e.g. "http://<MACHINE-IP>:8090", to allowedOrigins in the Xentara configuration file and restart Xentara. |
| Red “Connection to Xentara lost” bar | Xentara stopped or restarted. The Inspector reconnects on its own when Xentara is back online. |
| "Port is already allocated" | Port 8090 is in use. Go back to creating the Docker compose file (Part A Step 2 / Part B Step 3). In the second to last line of the copied command, change the left number to an available port (e.g. "9090:8080", and restart the container (run "docker compose up -d"). |
| "No configuration file provided" | Make sure you run the "docker compose up -d" command inside the folder that contains the "docker-compose.yml" file. |
| Status stays "(unhealthy)" | Check the logs, then run "docker compose restart". |
Still stuck? Our team can help you! You can open a ticket in our support portal at https://support.xentara.io/. Make sure to attach a copy of the docker logs.